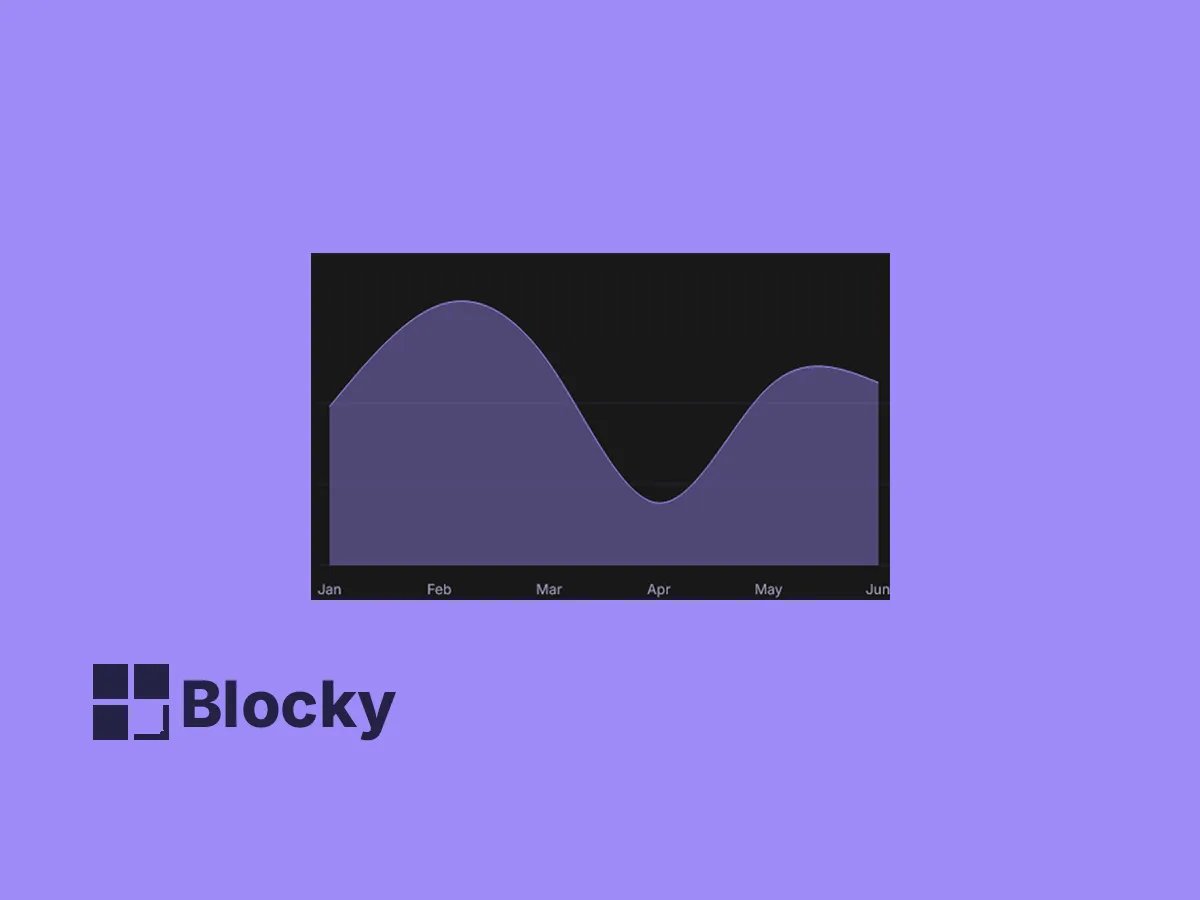
Area Chart
Visualize trends over time with a smooth area chart — great for tracking growth, engagement, or cumulative data in Notion.
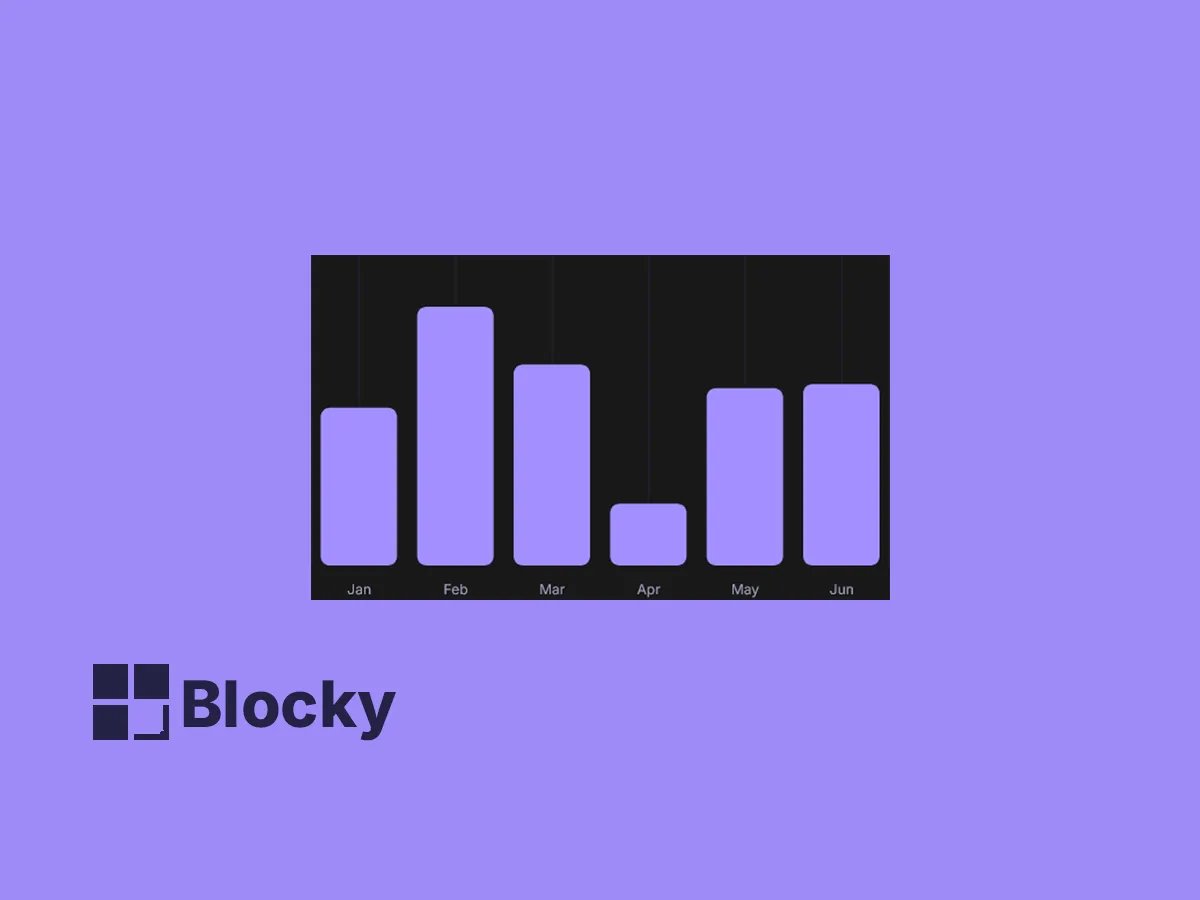
Bar Chart
Compare categories side by side using a bar chart — perfect for ranked data, checklists, or breakdowns at a glance.
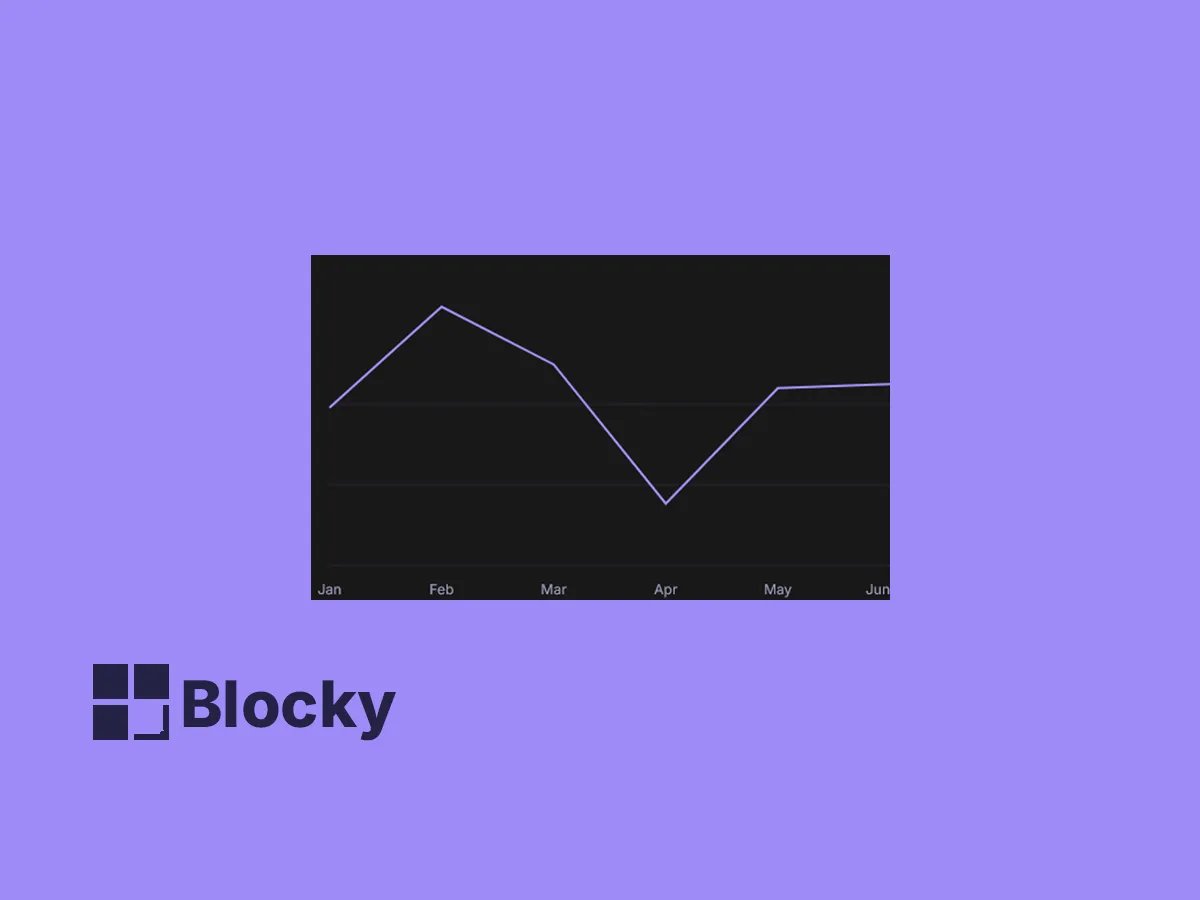
Line Chart
Display trends with precision using a line chart — ideal for performance tracking or any data with time-based progression.
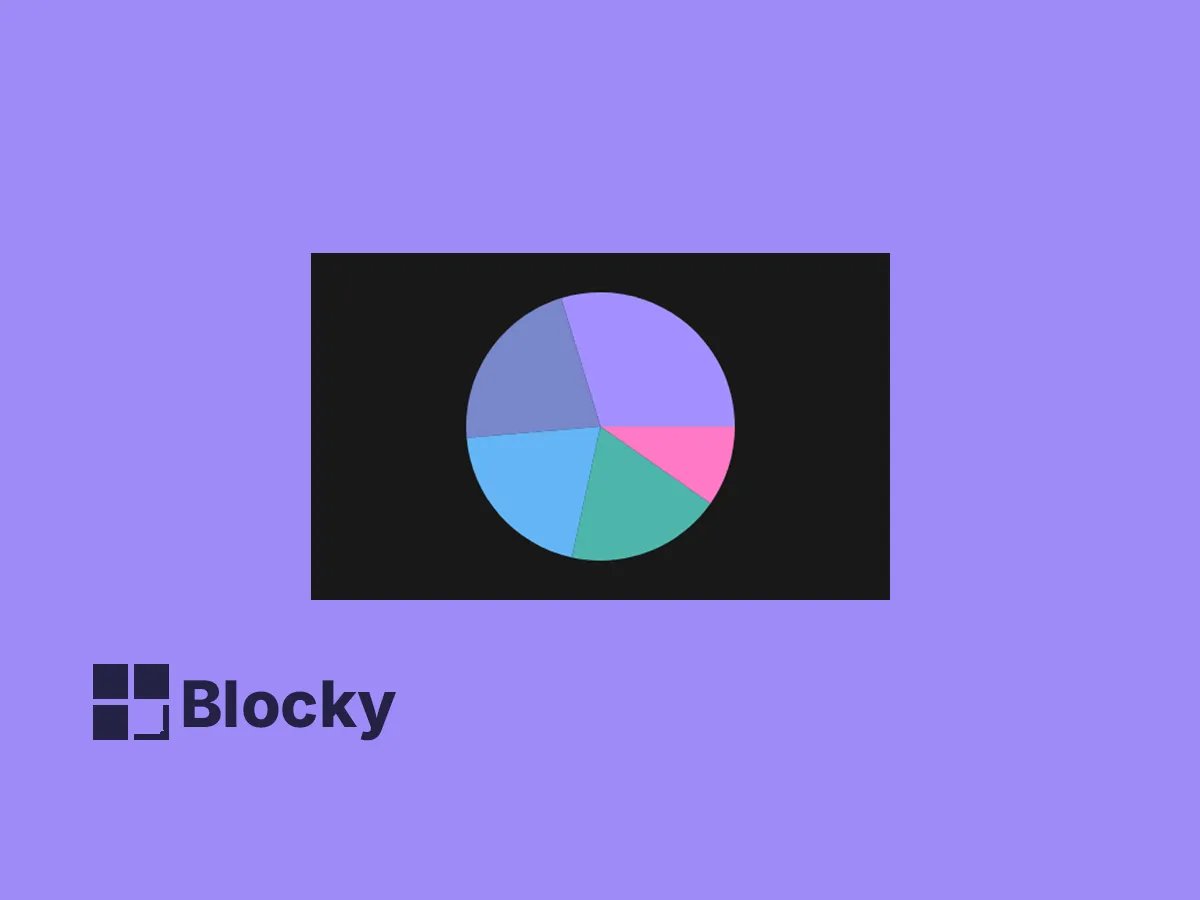
Pie Chart
Show parts of a whole with a clean, circular pie chart — perfect for breakdowns like budget, time allocation, or task status.
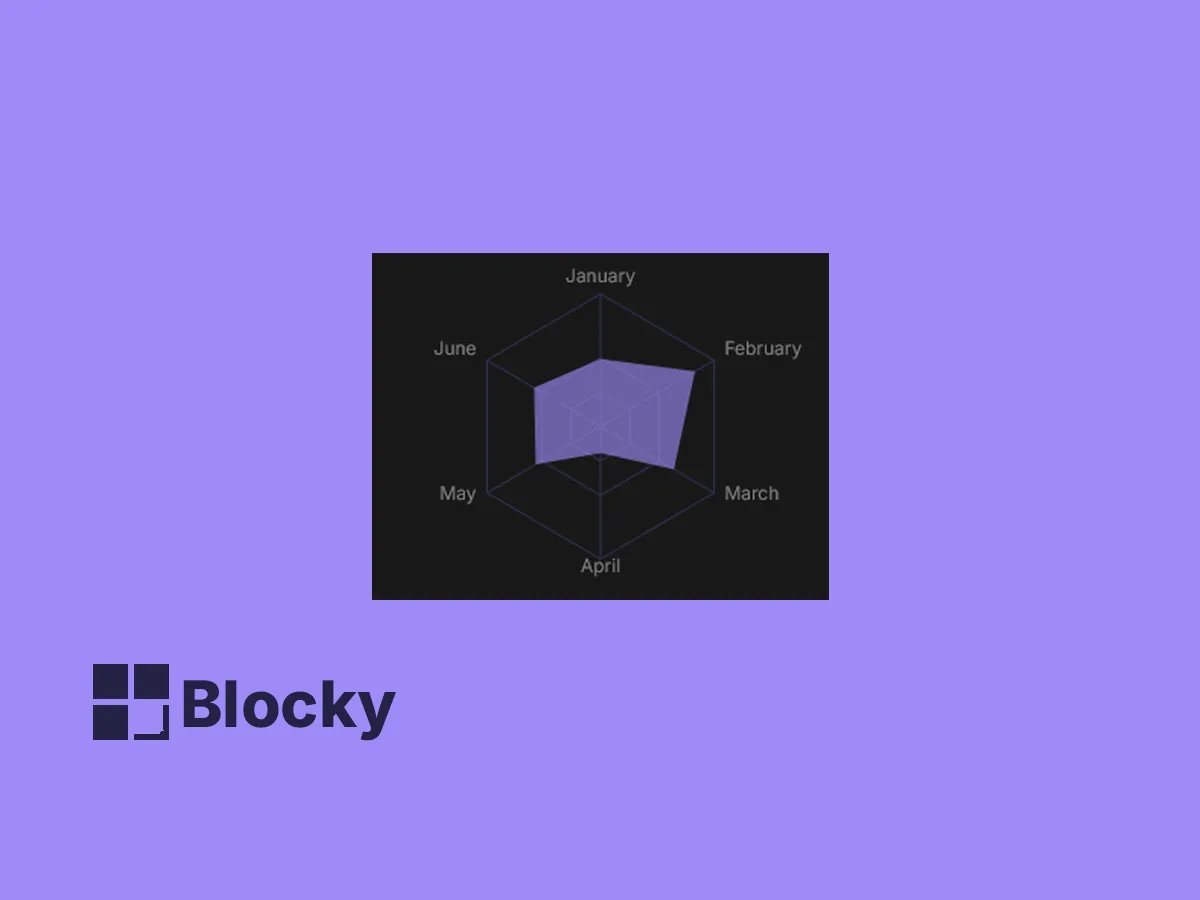
Radar Chart
Compare multiple dimensions or attributes in a single view — ideal for skills, goals, or performance profiling in Notion.
Radical Chart
Add bold, circular data visualizations with Radical Charts — perfect for showcasing progress, scoring, or range indicators.