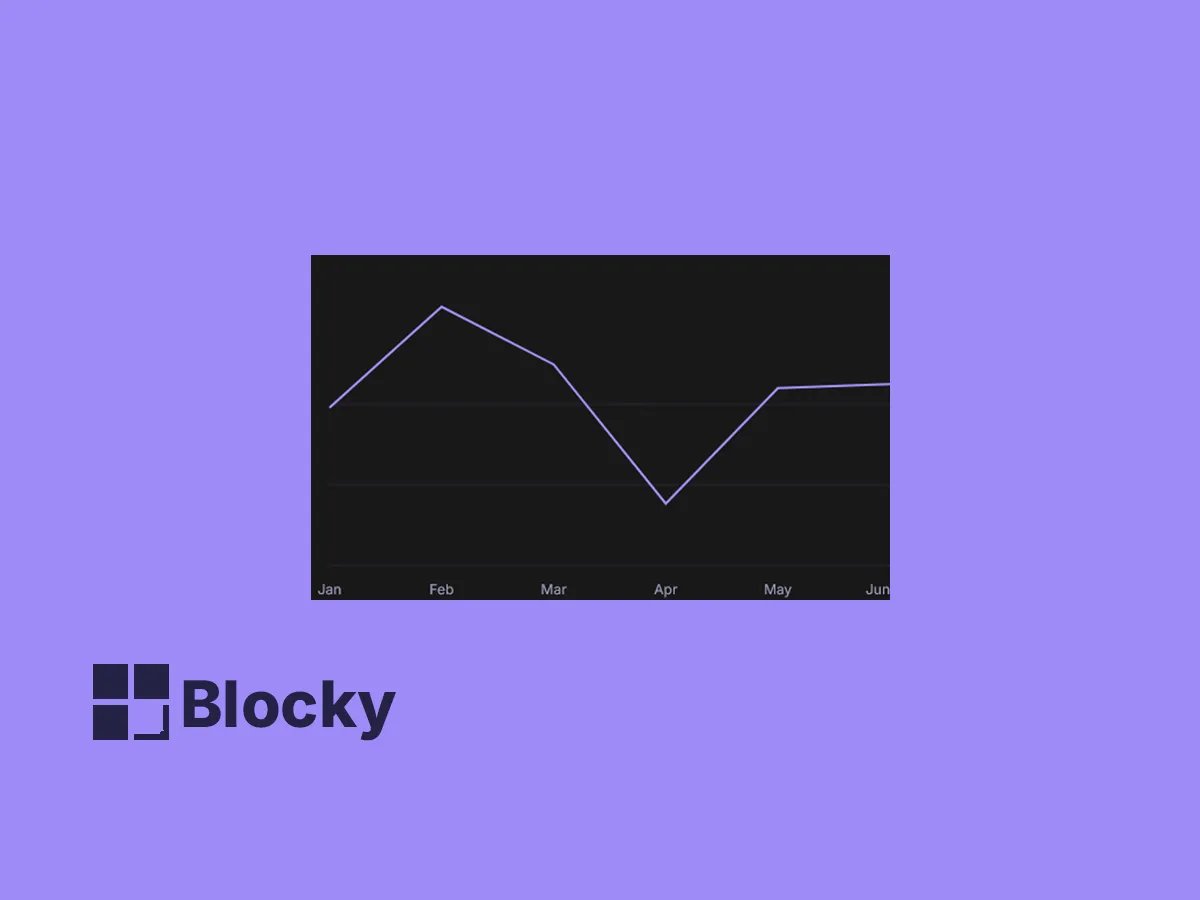
Linear Line Chart
A smooth and direct line chart to visualize continuous data trends — perfect for tracking metrics over time in Notion.
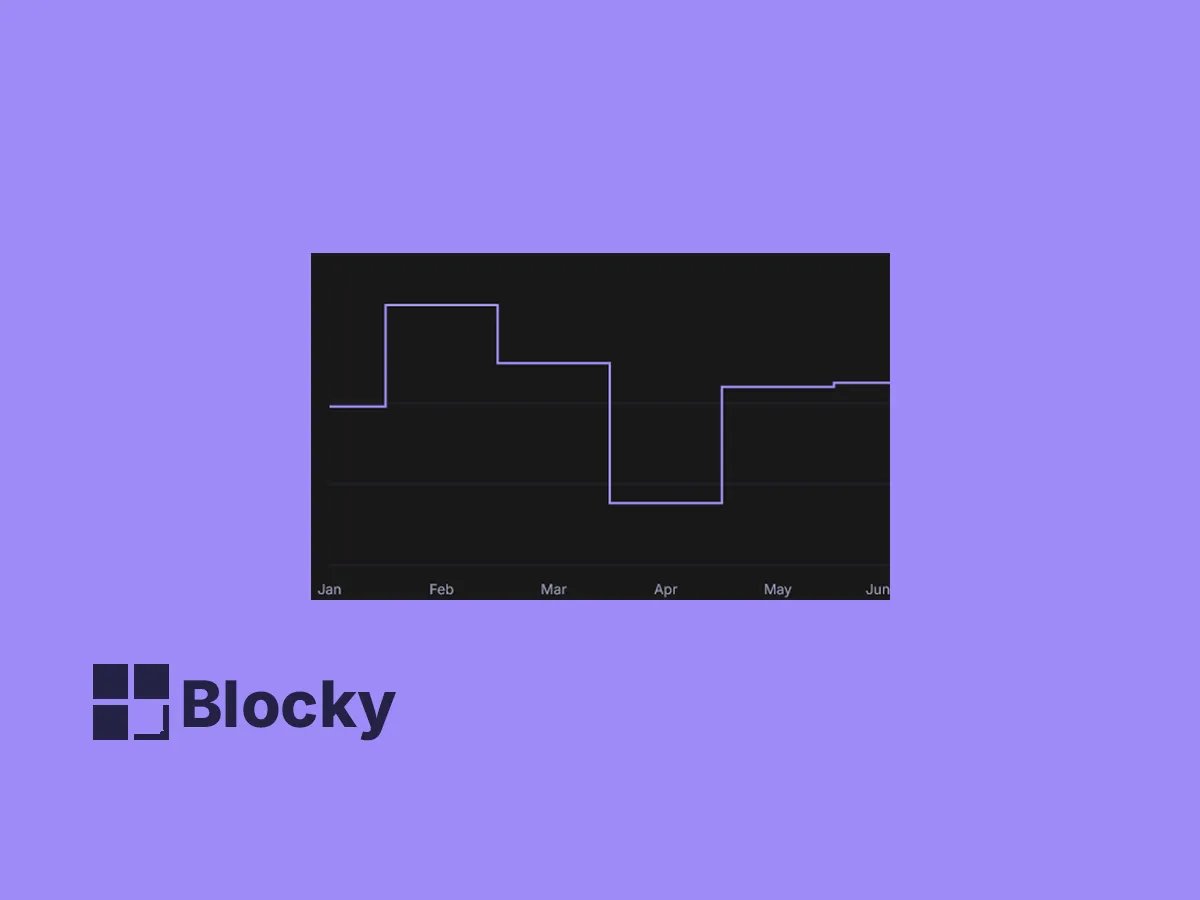
Step Line Chart
A step-based line chart designed for segmented or discrete values — ideal for progressions, phases, or comparison sets.
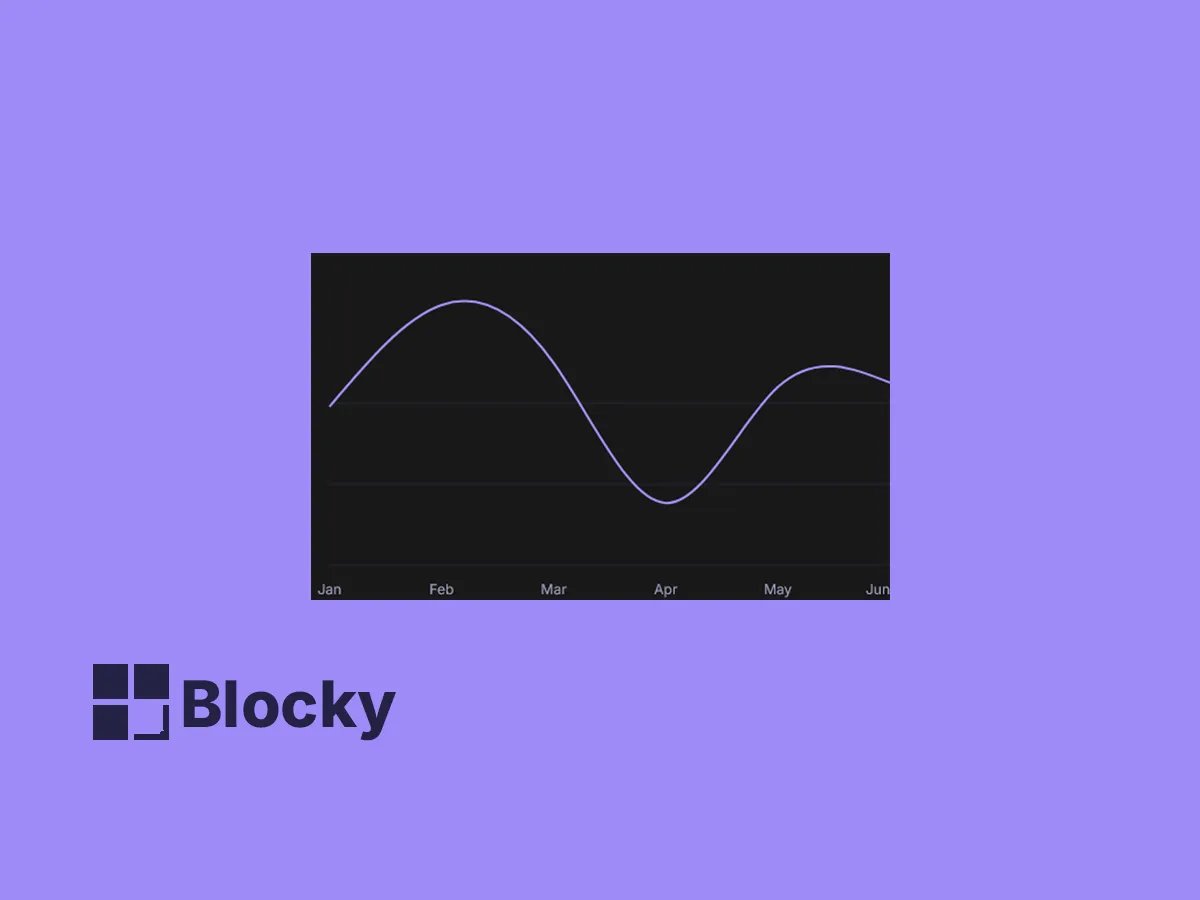
Natural Line Chart
An organic, curved line chart with a natural flow — adds aesthetic movement to your data-driven Notion pages.
Use Cases
Activity Monitoring
Visualize app usage, website traffic, or user interactions over time.
Study Analytics
Track daily study sessions or productivity patterns across weeks.
Stock Trends
Use embedded line charts to show daily or hourly fluctuations in stock prices or tokens.
Line Type Options
Linear & Step
Switch between linear or stepped lines based on your visual preference.
Interactive Markers
Custom Dots
Enable data points with customizable radius and fill options.
Label Control
Detailed or Minimal
Show or hide labels with precise positioning and color control.
Settings
| Setting Name | Section | Type |
|---|---|---|
| Show Legend | Legend | toggle |
| Min | Configure Chart Range | input |
| Max | Configure Chart Range | input |
| type | General | select |
| Stroke Width | General | slider |
| Show Dots | Dots | toggle |
| Radius | Dots | slider |
| Fill | Dots | color |
| Show Label | Label | toggle |
| Position | Label | select |
| Offset | Label | slider |
| Color | Label | color |
| Font Size | Label | slider |
| Tick Line | Axis Configuration | toggle |
| Axis Line | Axis Configuration | toggle |
| Format Label | Axis Configuration | input |
| Top | Margin | slider |
| Bottom | Margin | slider |
| Right | Margin | slider |
| Left | Margin | slider |
Track Your Data Flows Visually
Embed flexible line charts in your Notion page for accurate and beautiful trend tracking.